


Environmental sustainability
The United Nations Intergovernmental Panel on Climate Change (IPCC) published a report in October 2022, prior to COP27 in Egypt, stating that in order to meet the Paris Agreement goal to limit Earth’s temperature rise to 1.5 degrees Celsius, “global greenhouse gas emissions must be reduced by 43% by 2030.” According to the IPCC report, written by hundreds of leading scientists and agreed to by 195 countries, greenhouse gas emissions (GHG) generated by human activity have increased since 2010 across all major sectors globally.
UL Solutions has committed to examining and improving our own operations to reduce our global carbon footprint in alignment with the latest climate science. In 2022, we pledged to set GHG emissions reduction targets for our laboratories and offices to help limit global warming to 1.5° C through joining the Science Based Targets initiative (SBTi). The SBTi defines and promotes best practice in science-based target setting, offers resources and guidance to reduce barriers to adoption, and independently assesses and approves companies’ targets. Additionally, we intend to address and reduce our global waste and water usage, and to raise awareness of these environmental challenges among our global colleagues as we establish KPIs.
At UL Solutions - from people, to planet to prosperity - we believe our scientific leadership, corporate responsibility and customer solutions can help guide our planet to a cleaner, clearer and more stable future as we fulfill our mission of working for a safer world.
Committing to science-based emission reduction targets
In December 2021, Jennifer Scanlon, president and CEO of UL Solutions, signed a letter affirming our commitment to measuring, reporting and reducing our carbon emissions to help mitigate the ongoing threat of climate change. The Science Based Targets initiative – a partnership between CDP , United Nations Global Compact, World Resources Institute and World Wide Fund for Nature (WWF) and one of the We Mean Business Coalition Commitments – officially accepted this letter of commitment in January 2022. To date, more than 5,000 companies around the world have set science-based emission reduction targets with SBTi to limit global temperature rise to 1.5°C above pre-industrial levels, in alignment with the Paris Agreement.
This marked UL Solutions’ first public commitment to reporting and reducing our carbon emissions.
“Committing to the Science Based Targets initiative is in alignment with our mission to work for a safer, more secure and sustainable world,” said Barbara Guthrie, vice president of corporate sustainability at UL Solutions. As leaders in the ESG space, reducing our impact on global warming is not only essential for the viability of our business; according to Guthrie, “setting science-based targets will help us accelerate our progress to a more sustainable future for our people, our planet and our shared prosperity.”
As a member of the United Nations Global Compact since 2019, UL Solutions aligns our sustainability strategy with the SDGs. Our commitment to SBTi aligns with SDG #7 “affordable and clean energy,” SDG #12, “to ensure sustainable production and consumption patterns,” and SDG #13, “take urgent action to combat climate change and its impacts.”
- Read more
SBTi progress in 2022
SBTi’s acceptance of our letter of commitment in January 2022 initiated a two-year period (24 months) during which we are tasked to: 1) choose a baseline year for emissions; 2) collect our global emissions data; 3) establish a baseline of our emissions; and 4) declare a 10-year emissions target.
In 2022, we selected our baseline year (2022) and began systematically detailing our global emissions data. We received third-party verification from Apex Companies, LLC (Apex) on the GHG emissions shared in this report.

Commit
Submit a letter establishing your intent to set a science-based target

Develop
Work on an emissions reduction target in line with the SBTi's criteria

Submit
Present your target to the SBTi for official validation

Communicate
Announce your target and inform your stakeholders

Disclose
Report company-wide emissions and progress against targets on an annual basis
Categorizing emissions data
Scope 1 emissions are direct GHG emissions that occur from sources that are controlled or owned by an organization. Our scope 1 data includes global data for fuel combustion from buildings and vehicles, natural gas, refrigerant leakage, propane, and other fuels used in testing.
Scope 2 emissions are indirect GHG emissions associated with the purchase of electricity, steam, heating or cooling. Our scope 2 data includes global electricity, steam, heating and cooling data.
Scope 3 emissions, also called value chain emissions, comprise the majority of our total GHG emissions and result from activities of assets we do not own or control. We collected scope 3 data and evaluated each of the 15 scope 3 categories for relevance to UL Solutions and identified these relevant categories:
Scope 3 Categories Category 1: Purchased goods & services Included (material) Calculated following spend-based methodology Category 2: Capital goods Included (material) Calculated following spend-based methodology Category 3: Fuel- and energy-related activities (not incl. in Scope 1 or 2) Included (material) Calculated using Scopes 1 and 2 fuel consumption data Category 4: Upstream transportation and distribution Excluded Excluded as UL Solutions does not have any operational control of upstream logistics Category 5: Waste generated in operations Included (not material) Due to limited waste information, waste emissions have been calculated following a spend-based approach and are included alongside Category 1 emissions Category 6: Business travel Included (material) Calculated based on travel agency reports and internal travel data Category 7: Employee commuting Included (material) Calculated based on commuting survey results Category 8: Upstream leased assets Excluded Excluded as UL Solutions does not have any upstream leased assets Category 9: Downstream transportation and distribution Excluded Excluded as UL solutions does not produce any physical products Category 10: Processing of sold products Excluded Excluded as UL Solutions does not produce any physical products Category 11: Use of sold products Excluded Excluded as UL Solutions does not produce any physical products Category 12: End-of-life treatment of sold products Excluded Excluded as UL Solutions does not produce any physical products Category 13: Downstream leased assets Excluded Excluded as UL Solutions does not have any downstream leased assets Category 14: Franchises Excluded Excluded as UL Solutions does not have any franchises Category 15: Investments Excluded Excluded as UL Solutions is not a financial institution Global collaboration in collecting emissions data
Collecting emissions data required collaboration from many UL Solutions teams. The Corporate Sustainability team relied on the following teams to help accomplish the data collection challenge:
- Our Finance and Accounts Payable teams provided operations and financial data and utility invoices related to scope 1, 2 and 3 emissions data.
- Our Carbon and Energy Task Force contributed their expertise on GHG, decarbonization, emissions measurement and reporting. The members of this task force, many of whom are on our ESG Advisory and Assurance Services team, were essential to categorizing emissions data into scopes and determining reporting frameworks.
- The UL 360 sustainability software team helped assemble all emissions data in one place and configured the software to calculate emissions from consumption data and other data sources.
- Our Energy Services for Healthy Buildings team performed energy-efficiency assessments at our facilities, including four facilities in North America making up approximately 20 percent of our global footprint, and helped identify strategies to conserve energy and reduce carbon emissions.
- Our global site leaders and regional managers offered additional information and insights about sites’ activities and clarified utility usage, such as the source of heat used at the facility.
- Our ESG Advisory and Assurance Services team provided expert guidance in creating our carbon methodology documentation and in preparing for third-party verification.
The next phase of our commitment
As 2023 progresses, we are integrating more structured data management systems to enhance the accuracy, efficiency and comprehensiveness of data collection efforts. By December 2023, we intend to submit our global data and emissions targets to SBTi for validation.
In 2023 we will establish a SBTi Reduction Plan Working Group to explore how we can optimize our decision-making to reduce our carbon emissions. The working group will develop a list of actions that can significantly impact emission reduction, serving as a starting point for evolving our company’s spending, travel and operations.
Our dedicated SME task force, the Carbon and Energy Task Force, will remain in place to provide technical guidance in fine-tuning data collection methodologies, calculating emissions and developing a comprehensive decarbonization strategy. We’ll continue utilizing UL 360 sustainability software to capture and analyze our environmental data for reporting and tracking our progress. Our ESG Advisory and Assurance Services team will provide ongoing guidance to better understand and refine our carbon methodology and our Energy Services for Healthy Buildings team will assess our campuses to identify energy conservation opportunities.
Pamela Diaz, senior manager of environmental sustainability at UL Solutions, emphasizes the importance of our public commitment to improving our impact on the environment through carbon emission reduction. “To better serve our customers,” Diaz said, “we must continue to advance our leadership in ESG. Our commitment to SBTi is a critical step in doing so.”
Operationalizing environmental impact
As a professional services organization operating laboratories around the world, our facility energy use is a large contributor to our carbon emissions. Our stakeholders understand this; energy took the top-ranked spot as a material environmental topic in our 2022 materiality assessment. As such, we are looking at ways to optimize our energy efficiency to reduce carbon emissions while still fulfilling our safety science mission.
To meet our science-based target commitment and other environmental goals, we intend to address and improve operational efficiency across our sites. We’ll rely on our in-house expertise and sustainability solutions to guide us on our way, sharing our sustainability journey along with our customers. Our Energy Services for Healthy Buildings team have performed energy-efficiency assessments at select facilities to help identify opportunities to conserve energy, and our Software and Advisory experts will continue to advise on emissions data and decarbonization strategies.
Energy and Carbon Task Force – The Energy and Carbon Task Force reports to the CSC and consists of SMEs from across the business tasked with examining improvements to our energy consumption. This group helped develop the processes and solutions to commit UL to a science-based target. Moving forward, this employee task force will offer guidance on strategic virtual power purchase agreements for the organization, installing electric vehicle (EV) charging stations at select offices and performing behind-the-meter (BTM) studies to determine the optimal energy mix.
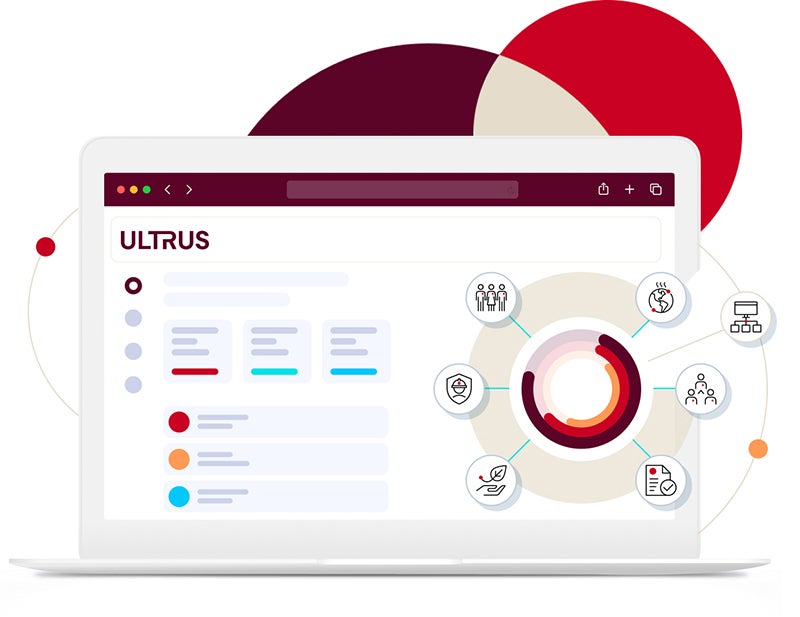
UL 360 Sustainability software
We employ our own sustainability software, UL 360 Sustainability, to capture and analyze our sustainability data for reporting and to track our environmental progress. This enables us to effectively collect and validate our quantitative and qualitative data from around the world and engages our employees in a collaborative effort to contribute to improving our environmental impact. We also utilize the Frameworks module within the software to collect and govern all our ESG disclosures for the GRI. In 2022, UL 360 Sustainability continued its Gold-level Carbon Disclosure Project (CDP) Software Partner status for the 11th consecutive year, the CDP’s highest ranking for an accredited software provider.
Energy
Carbon reporting methodology
Organizational boundary
The reporting boundary for this reporting cycle includes all UL Solutions’ owned and leased locations with operational control for the calendar year. ‘Operational control’ includes any site where we are responsible for any of the following: electricity; heat\air conditioning (environmental control); or maintenance. Due to the nature of our operations, UL Solutions maintains a variety of facility types, including laboratories, offices, warehouses and combination facilities.
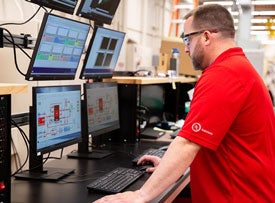
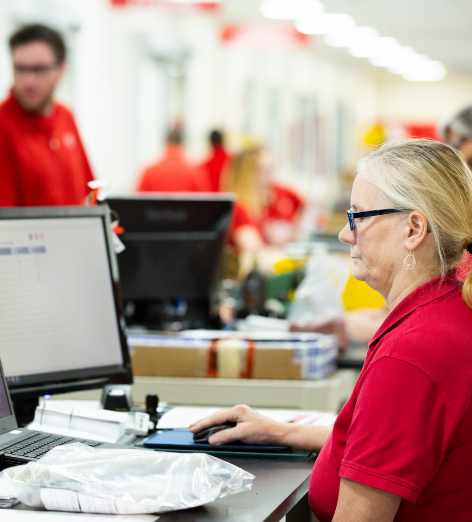
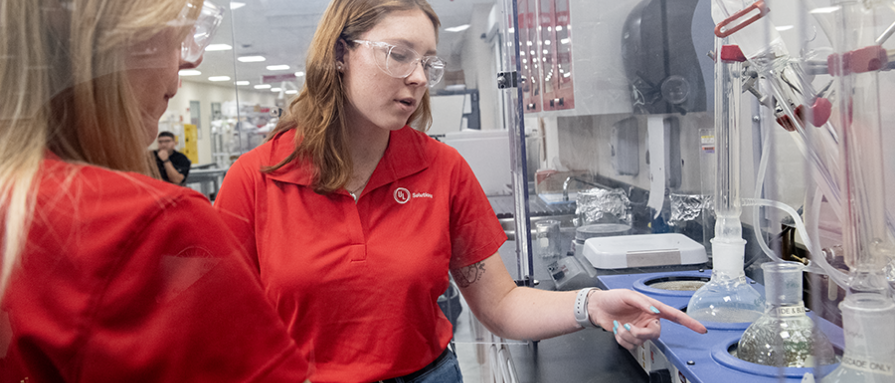
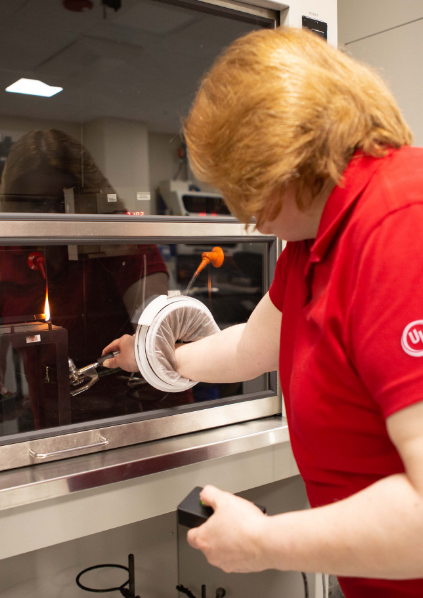
Laboratories: Much of our leading safety, security and sustainability work happens in our laboratories, where our engineers and laboratory technicians utilize testing equipment and instruments to complete their work.
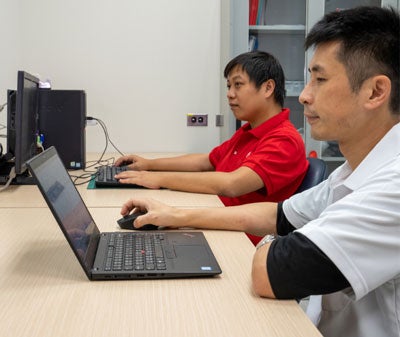
Offices: Many UL Solutions employees work in offices. This office-use space consumes less energy than our laboratory-use space, where tests may run for multiple days, consuming energy both day and night. Our offices typically have lower energy consumption during non-working hours.
Warehouses: These locations have minimal utility usage as they function as storage.
Emissions boundary
UL Solutions’ carbon footprint encompasses Scope 1 (direct) and Scope 2 (indirect) GHG emissions from electricity production, and Scope 3 (indirect) from business activity.
UL Solutions has a significant Scope 1 carbon footprint due to certain testing procedures that require the use of stationary gases. Our SMEs in energy technologies are exploring applying data and predictive modeling to enhance our traditional testing and reduce our emissions.
Scope 1 and Scope 2 Emissions (market-based)
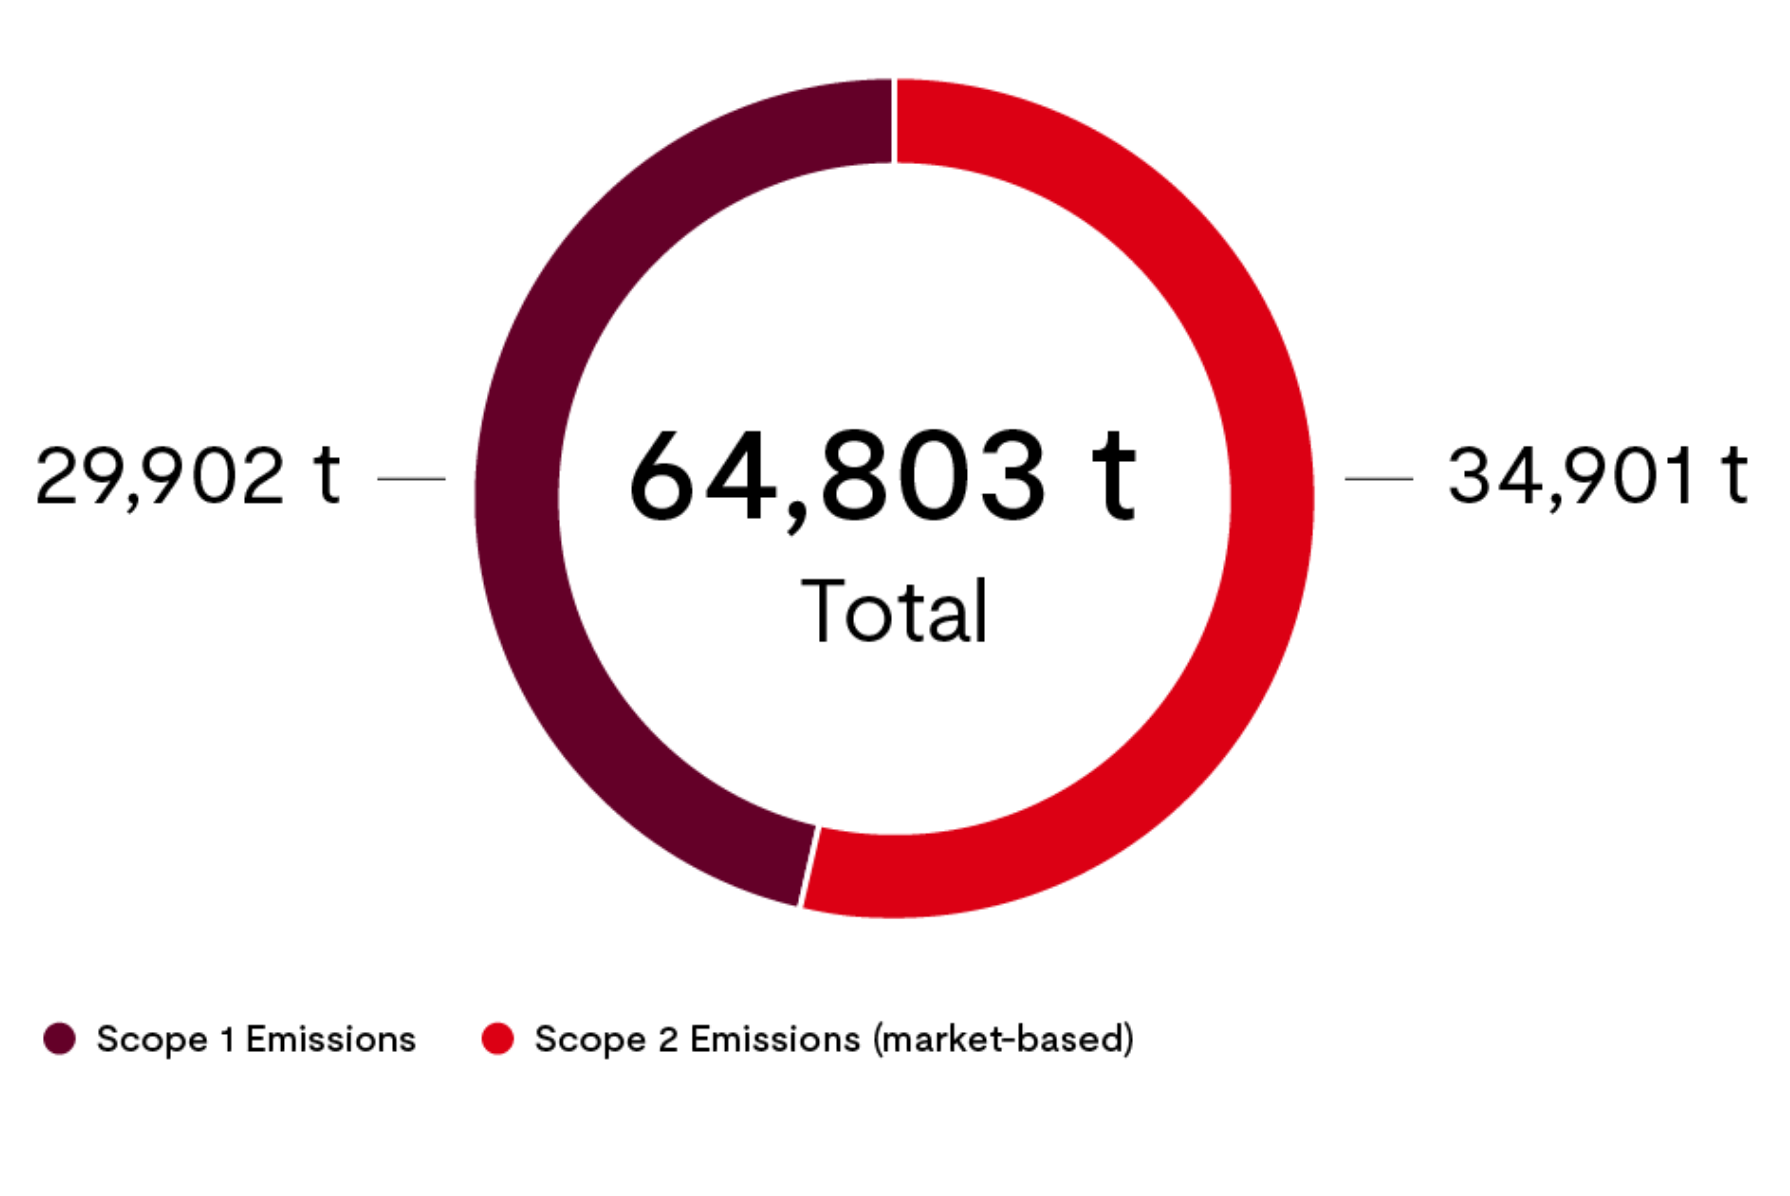
In 2022, our global Scope 1 emissions were 29,902 tonnes of carbon dioxide equivalent (CO2e).
Global Scope 2 (market-based) emissions were 34,901 metric tonnes of CO2e. Global Scope 2 (location-based) emissions were 44,202 metric tonnes of CO2e.
Scope 3 material emissions
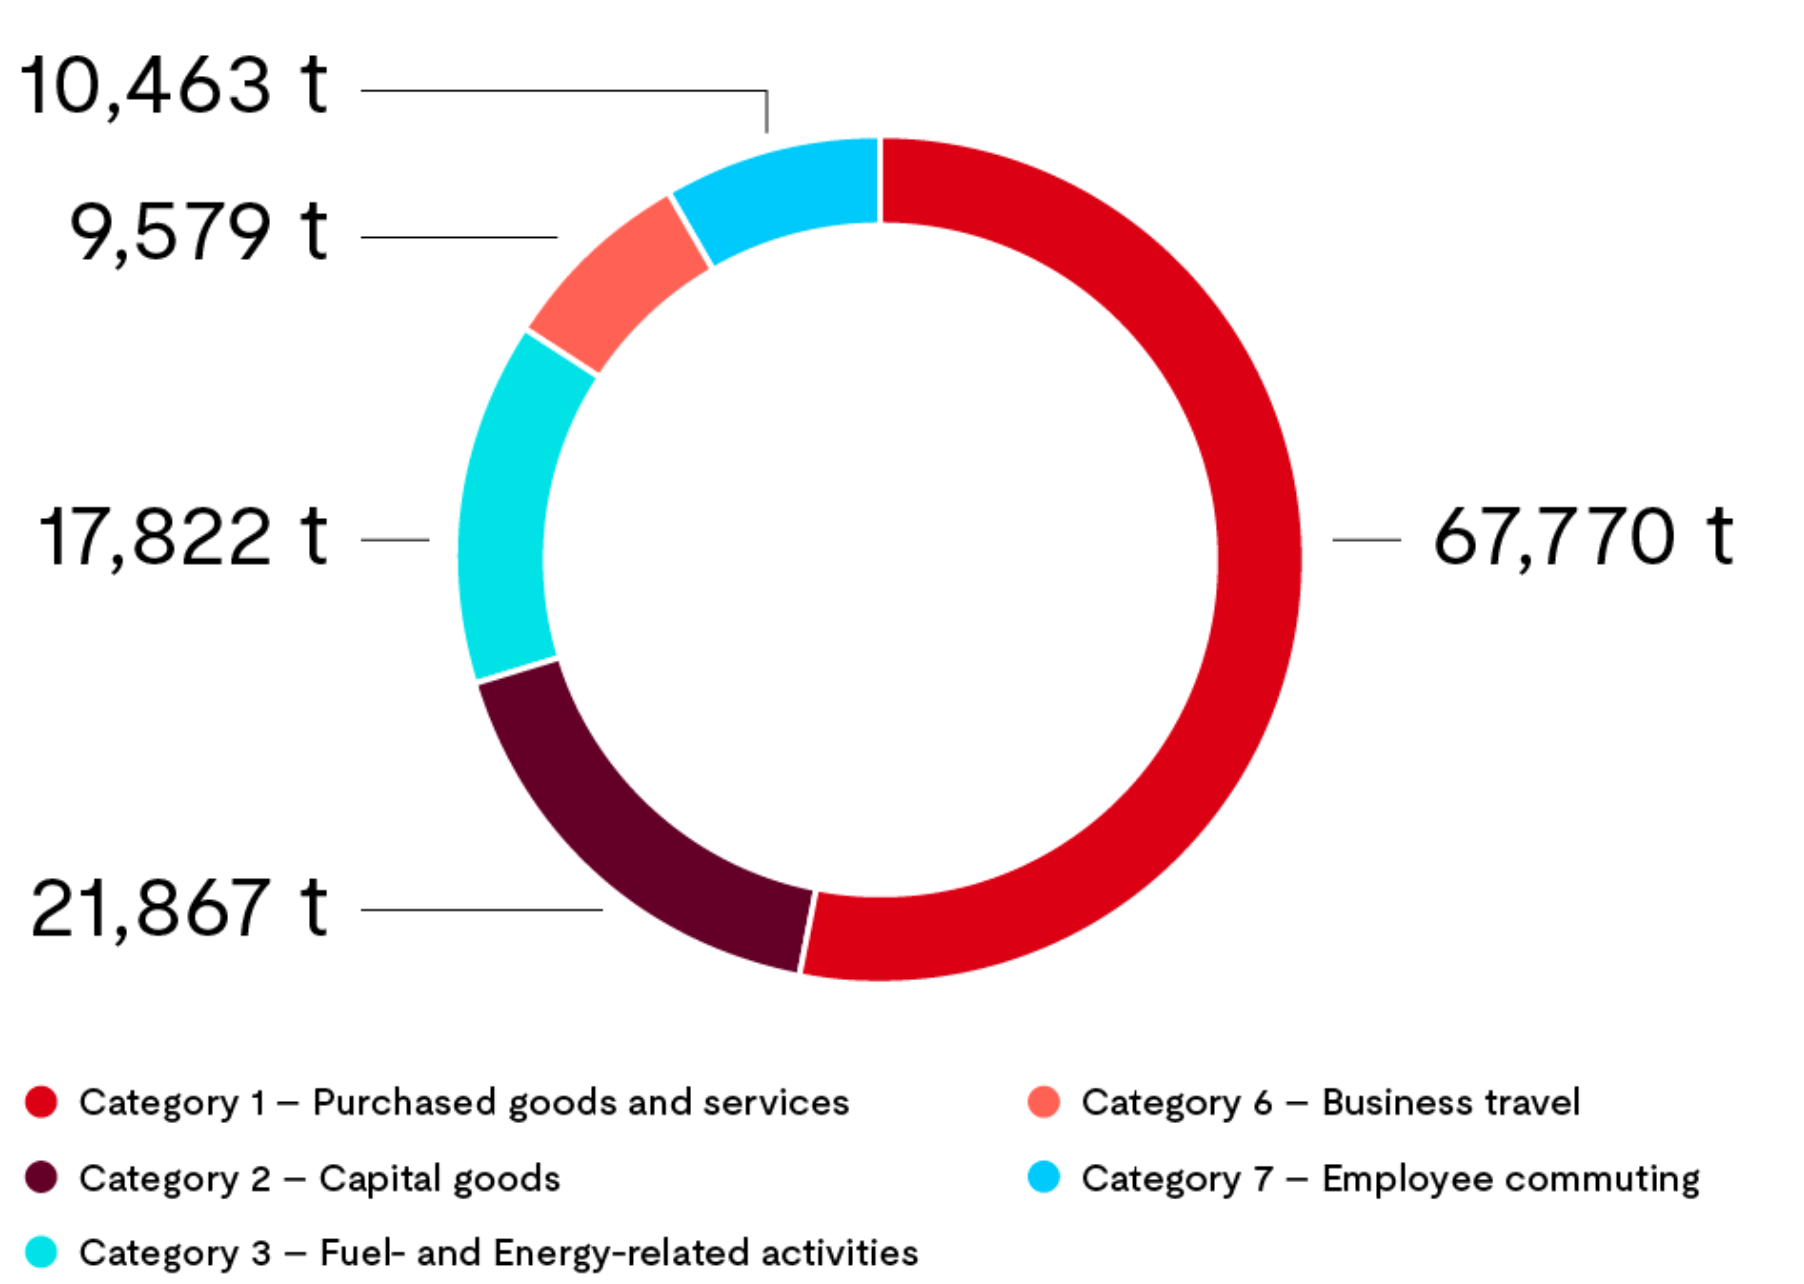
Global Scope 3 emissions for 2022 per category were:
Category 1 - Purchased Goods & Services: 67,770 metric tonnes of CO2e
Category 2 - Capital Goods: 21,867 metric tonnes of CO2e
Category 3 - Fuel and Energy-Related Activities: 17,822 metric tonnes of CO2e
Category 6 - Business Travel: 9,579 metric tonnes of CO2e
Category 7 - Employee Commute: 10,463 metric tonnes of CO2e
These values include estimates for sites where we could not obtain actual consumption data. Estimates are based on intensities (tonnes CO2e per headcount or per square foot).
Completeness – 100% of owned and leased facilities globally where UL Solutions has operational control.
Consistency – Global Scope 1 and Scope 2 consumption data is input and managed within our UL 360 Sustainability software tool and relevant emission factors are applied within the tool to calculate total emissions.
Accuracy – A third-party service provider collects data directly from the utility suppliers or the UL Solutions Corporate Sustainability department where a direct connection to the utility supplier cannot be made. Apex has provided limited assurance of our reported GHG emissions.
Scope 1: 80% of our total global square footage is accounted for with data reported by the utility supplier. 20% is estimated.
Scope 2: 98% of our total global square footage is accounted for with data reported by the utility supplier. 2% is estimated.
Scope 3 data includes global data from material categories including Purchased Goods & Services (Category 1), Capital Goods (Category 2), Fuel and Energy-Related Activities (Category 3), Business Travel (Category 6) and Employee Commute (Category 7).
In 2022, our global electrical consumption totaled 98,651,956 kWh.
Our 111-acre Northbrook (NBK) IL headquarters campus represents the largest footprint of any of our sites around the world. We purchase Green-e® certified renewable energy credits (RECs) to cover 100% of our NBK electricity demand. We purchase renewable energy certificates from European wind production that are equivalent to 100% of our power consumption for our sites in Ballerup, Denmark and Arnhem, the Netherlands.
Our digital sustainability journey
Most of us are familiar with ways to reduce the consumption of electric power at home — turning off lights and computers, turning down thermostats and unplugging appliances, for example. But we may not have always considered the environmental impact of our digital activities in our homes and in the workplace. Every email we send and store, every website we visit, every document we download, and every video we stream comes with an energy cost.
At UL Solutions, our Web Content Design and Publishing team is working to reduce the digital footprint of our website as part of our overall emissions reduction journey.
- Read more
Digital energy consumption
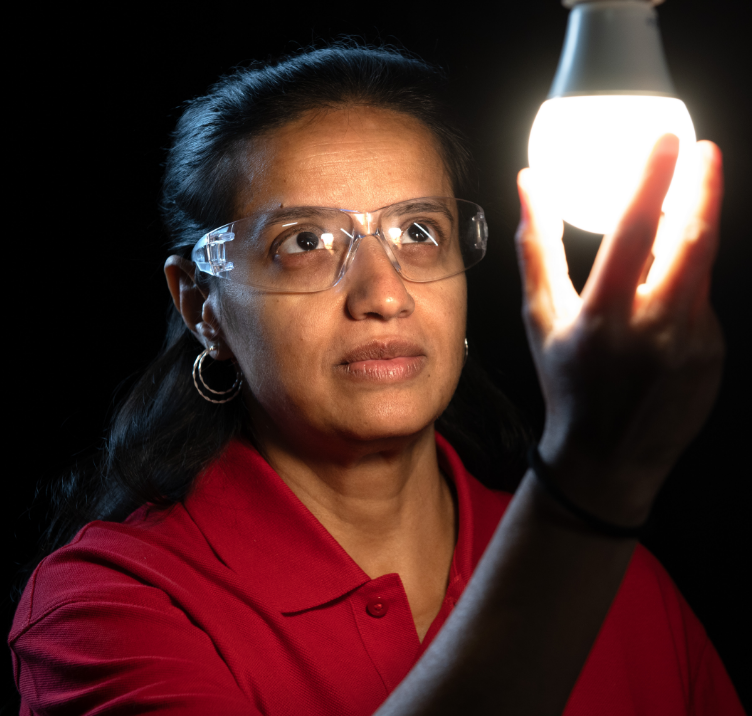
The environmental impact of digital content seems invisible, but every pixel and gigabyte has its energy cost. Billions of people use billions of electronic devices to access online content every day. Energy, largely from fossil fuels, is being drawn to power these devices, and data centers and network services use immense amounts of electric power. And deeper down, the digital content itself is drawing energy.
Each time a webpage loads, it uses energy. If the webpage contains a lot of content, that energy use increases. If the page has large images or video, the energy use multiplies. If we refresh the page or close and reopen it, that energy use is repeated. When we use a search engine, energy is used to mine answers to the query and populate the millions of possible results. Scrolling through those results uses exponentially more energy. Each search query is equal to turning on a 60W light bulb for 17 seconds (about 0.0003 kWh and 0.2g of CO2). Multiply that by millions, potentially even billions of searches per day — and we can begin to understand the environmental impact of digital content.
Digital sustainability
In response to this growing awareness around digital energy consumption, in 2019 our Web Content Design and Publishing team initiated an overhaul of company websites, consolidating, migrating and retiring sites for a streamlined, but still weighty, main site. Then, a 2021 site redesign enabled our team to incorporate sustainability into the digital strategy. A strategic search engine optimization (SEO) program, both technical and on-page, was implemented and aimed specifically at improving our search engine presence and content experience. Duplicate and outdated pages were jettisoned, allowing for more useful and usable search results, and retained pages were optimized for keywords and performance, increasing our content visibility and helping drive searchers toward the content they want to find.
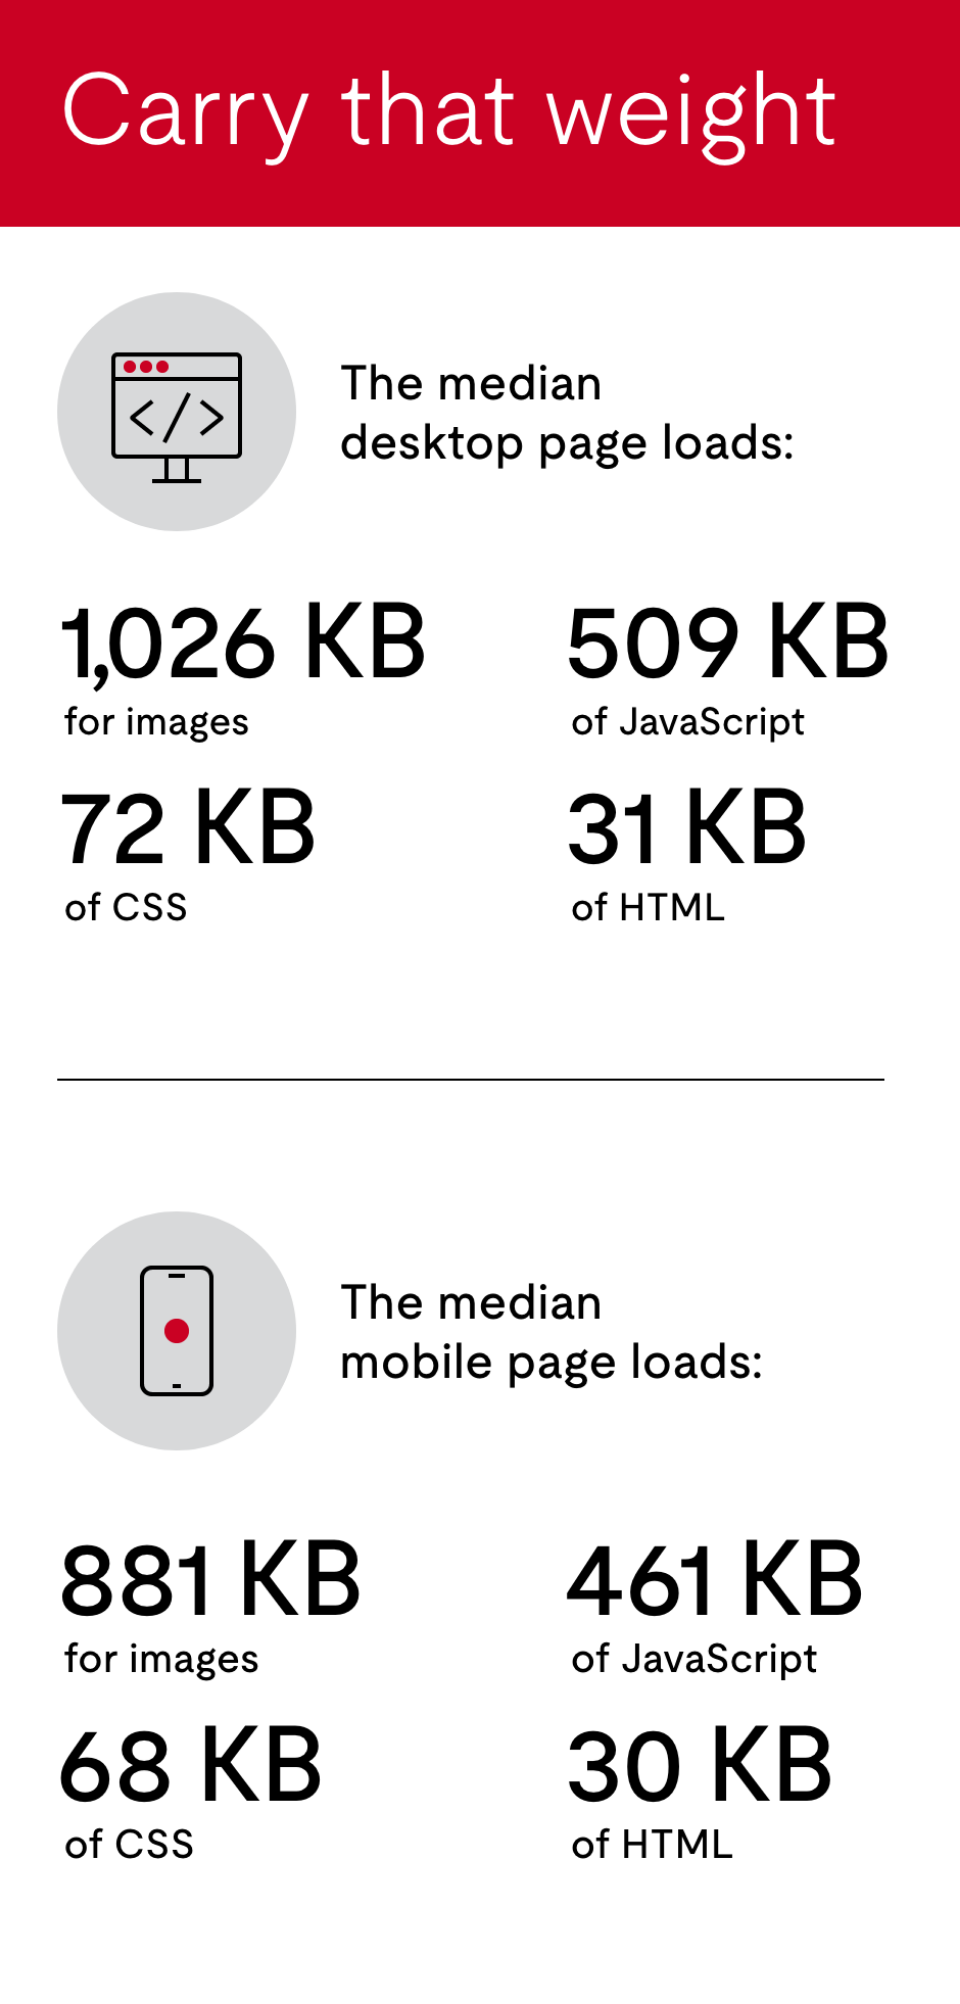
There is a relationship between page weight, page speed and energy use: the heavier a page, the more time and energy it needs to transfer the data used to display the content. Without detailed insight into end-user networks and devices, managing the weight of each web page, its byte size, is critical. On ULSolutions.com, large images and videos are being reduced or eliminated, and other content-tightening measures are being taken to make our web pages as light as possible. These practices are being used to reduce the digital footprint of our sustainability reporting, as well.
In 2022, our estimated company website’s page weight (page views x 2 MB) was 13,307,078 MB, for a data transfer rate of 13,307 GB. Back when our sustainable content journey began in 2019, the page weight totaled 21,100,108 MB and our data transfer rate sat at 21,100 GB. Those numbers can be translated into more tangible terms: in 2019, the environmental impact of our digital operations amounted to 7.4 metric tons of CO2, the equivalent of 1.6 gas-powered vehicles being driven continuously for one year. By 2022, we had cut the digital impact to 4.7 metric tons of CO2. A nice reduction, but still the equivalent of one gas-powered car being driven for one year. As our company site and digital content expands, we are positioned with strategy and governance to continue reducing the environmental impact of our publishing activities while delivering optimum content experiences to our customers.
“Knowing that every content decision has an environmental impact has deepened our commitment to managing content as a strategic business asset."
What’s next?
At UL Solutions, our digital sustainability program has shown positive results, but the use and expansion of digital content is increasing. Our efforts to manage this increase also need to grow and improve. We intend to look at how content is developed across our organization, validate the rough digital energy data, identify benchmarks and performance targets, optimize page/site performance and explore additional opportunities to continue reducing the environmental impact not only of ULSolutions.com, but also that of our other digital properties.
UL Solutions content and systems will be continuously measured for environmental and financial impact and progress. We hope to continue to decrease digital consumption while still sharpening content, making for the most economic use of digital energy and reducing our overall environmental impact. Our sustainable content journey is just beginning, but it is already a big part of our efforts toward a cleaner and more efficient future.
Water
We’re committed to exploring our water usage especially in water scarce regions and finding new ways to recapture and reuse water. Where we need water to perform our testing services, we intend to prioritize our efforts to monitor water consumption and plan and adjust based on potential water risks as we continue to find ways to implement water efficiency best practices at all locations.
We are sharing our 2022 water data from our headquarter campus in Northbrook (NBK) which represents roughly 30 percent of our global footprint as we establish a process for collecting and sharing global water consumption in future reports. In 2022, we used 20,110,057 gallons at NBK.
Waste
We are examining ways to divert waste from landfills and seeking responsible, collaborative and innovative methods to repurpose the materials that leave our facilities. As we meet increased needs for testing, we face the challenge of deploying responsible methods to dispose of the materials that leave our owned and operated locations.
Our engineers need to conduct stringent, robust and repetitive tests. They may involve applying extreme heat, duress and other stressors to prove a product’s safety for use. Those tested products often become part of our waste stream, along with any temporary structures created to perform specific tests.
We intend to develop a process for collection of baseline global waste data to measure and report our impact.
This year, we are sharing waste data from our global headquarters at NBK, which represents roughly 30 percent of our global footprint.
2022 NBK Waste Data:
Total Landfill: 1486 Tons;
Total Recycled: 9 tons
When possible, we divert our waste from landfills through methods such as recycling and incineration. However, we prioritize collaboration with our business partners to find even more ways to responsibly dispose of or repurpose our waste.
Waste and Materials Task Force
Our Waste and Materials Task Force includes internal SMEs to help us improve our waste and material management. This task force will identify opportunities to reduce waste generated from operations, provide guidance on systemic waste reduction practices and develop tools to simplify and sustain recycling efforts across our laboratories and global sites.
Environmental compliance
We maintain a robust environmental compliance program as a critical aspect of our continued success. UL Solutions generates air emissions, stormwater, wastewater, hazardous and nonhazardous waste, and manages hazardous chemicals. Responsibly managing our environmental outputs is our duty to our stakeholders including, but not limited to, employees, neighbors and surrounding communities, suppliers and customers, and society at large.
Our global environmental compliance team identifies opportunities for improvement, including short- and long-term goals, and facilitates program development. We are establishing a Laboratory Risk Management Governance Council to develop and enforce global governance of Risk Management, Safety, Environmental Compliance, Security, and Business Continuity.
UL Solutions embraces the highest ideals for environmental compliance. We are in the process of standardizing policies and procedures, with an emphasis on implementing stringent compliance policies at our global sites.
We are expanding our Environmental Management System (EMS) to effectively manage environmental compliance obligations. The EMS creates a centralized location to distribute environmental tasks and action items. It allows the tracking of action items to completion and the generation of meaningful metrics and key performance indicators.
The environmental team collaborates with UL Solutions’ insurance manager to enable us to maintain environmental liability insurance, and environmental compliance liabilities are evaluated during the due diligence of future potential acquisitions.
In 2022, there were no significant fines, cases or non-monetary sanctions for non-compliance with environmental laws or regulations. We have not identified any material non-compliance with environmental laws or regulations in 2022.